On the “Top 10 Riskiest Cities” and Getting Mauled by Bears
In late March the large re-insurer Swiss-Re published a report ranking the world’s 616 largest urban centers according to risk from natural hazards. The report conveniently summarizes the findings in a “Top-10” ranking, filling our insatiable desire for easily digestible and shareable information.
Unsurprisingly, the report has led to a landslide of news coverage (pun-intended)—in particular from the cities on the list—with such titles as: Tokyo Riskiest City in the World, Ranked: 10 Riskiest Cities In The World For Natural Disaster, Swiss firm says Manila 2nd ‘riskiest city’ in the world, L.A. Is a Top-10 World City for Natural Disasters, and others from the Guardian, New York Post, GulfNews, MSN News, and more.
One of the intended purposes of the report is to increase awareness of risk to our urban centers. The significant news coverage it has received is a promising sign as to the potential impact of such reports. Indeed, hurricane Sandy in New York and the 2010 earthquake in Port-au-Prince, Haiti are evidence of the tremendous impact of disasters on cities both rich and poor. The Swiss-Re report is an ambitious attempt to quantify risk to global cities, promoting awareness of this risk and so hopefully promoting increased investments in risk management. “Understanding the risks faced by cities is a necessary first step to better prepare them for future catastrophes.” I agree wholeheartedly with this statement! This is about the extent of my agreement with the report however, and the rest of this article is a critique of the analysis conducted and logic used in the report. The technical shortcomings are significant, and frankly surprising from such a prestigious reinsurance firm.
The report provides a ranking for several measures, but my comments are focused solely on the main ranking, which has received the most attention. I share it below:
(1) Tokyo-Yokohama, Japan
(2) Manila, Philippines
(3) Pearl-River Delta, China
(4) Osaka-Kobe
(5) Jakarta, Indonesia
(6) Nagoya, Japan
(7) Kolkata, India
(8) Shanghai, China
(9) Los Angeles, United States
(10) Tehran, Iran
Part of my interest in the ranking stemmed from how much it differred from my own, purely non-scientific mental list (David’s gut-feeling top-10 list of riskiest cities). This feeling was echoed by some of my colleagues. Where are Dhaka, Istanbul, Port-au-Prince, Goma? So I was intrigued to dig deeper into the report. Here are some of my findings and thoughts.
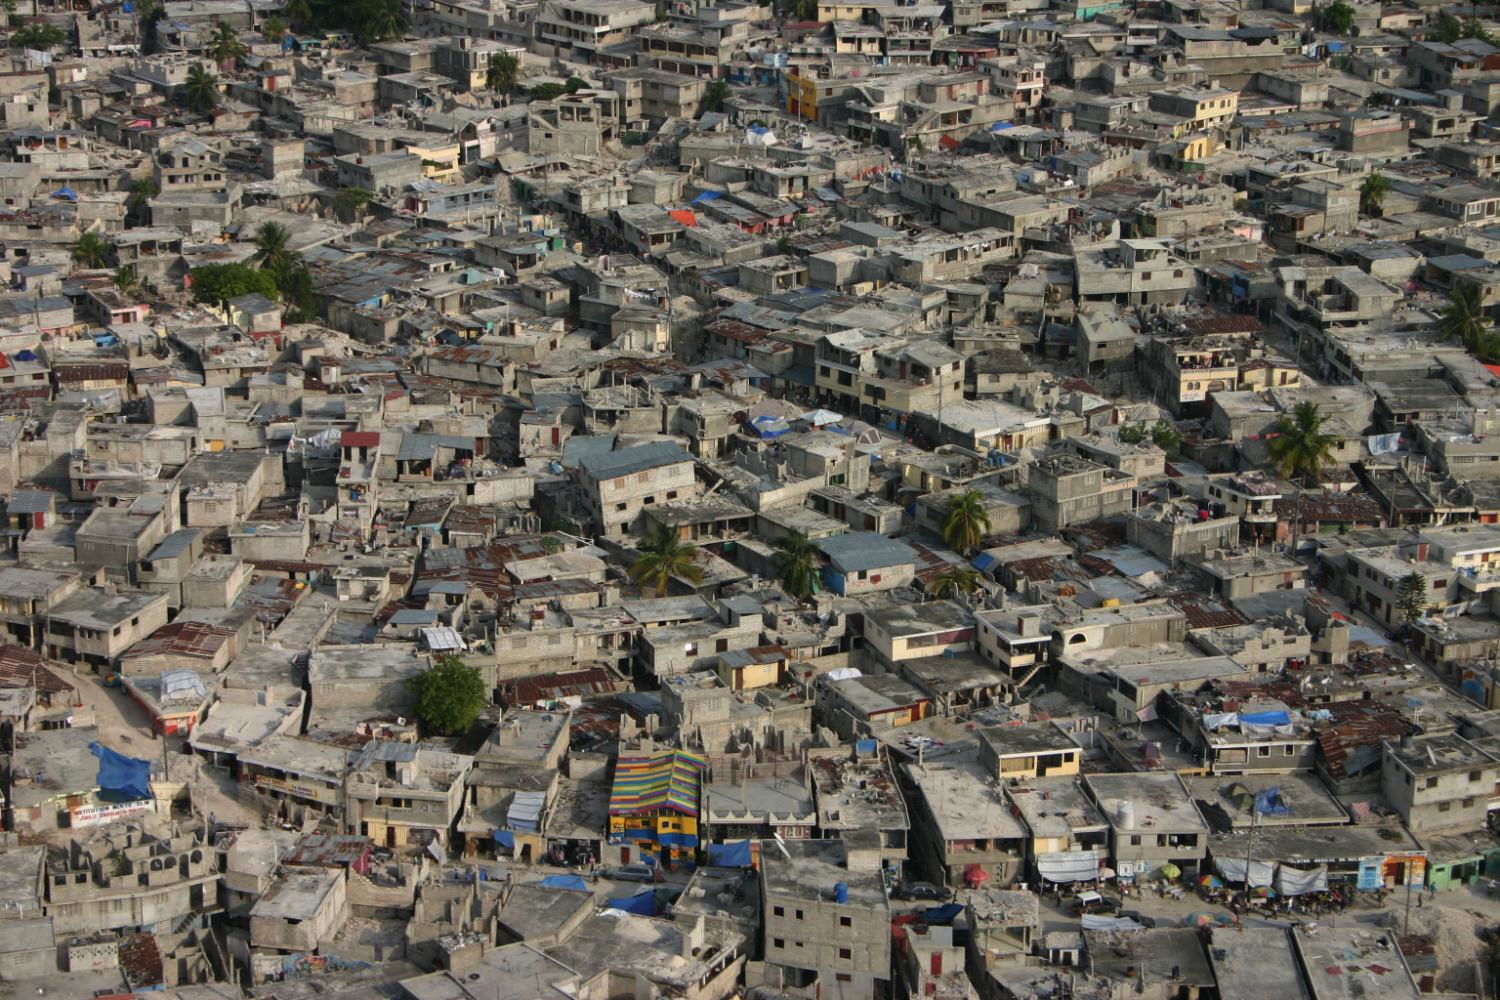
Aerial picture of Port-au-Prince, Haiti, 2010. Picture by Jean-Martin Brault.
First, the list does not actually measure “risk”. In-fact never in the Swiss-Re report does it claim to be measuring risk per se. The ranking is of the total number of people potentially affected by natural disasters, cumulated for five perils (simple addition). Hence smaller incredibly risky cities such as Port-au-Prince would clearly not appear on the list (3 million makes it a small-ish city). So while this may explain some of the cities mysteriously missing from the ranking, the actual measurement used in the ranking is nonsensical. Here are some of the reasons.
The hazard scenarios seem arbitrary. The only description of the hazards used in the study is troubling:
“We focused on rare catastrophes: a hurricane with winds substantially stronger than Sandy or a tsunami similar to the one triggered by the Tohoku earthquake in Japan. Statistically, a city would be hit by such an event once every few hundred years or less.”
I have rarely read a less descriptive quantification of hazard recurrence, and the use of the word “statistically” in the same sentence adds insult to injury. “A couple hundred years or less” literally means anywhere from 1 to 1000 years. For those interested, my age is “a couple decades or less.”
Furthermore, aggregating the impact of individual hazard scenarios from each peril has little meaning. For an industry so enamored with “annual expected losses” (AEL), simply adding up the impact from a single scenario of each peril is very surprising. It simply biases the ranking towards very large cities exposed to multiple hazards (though we note that volcanic risk is curiously absent… with no explanation for this omission). Even if each peril scenario has the same recurrence rate (which is dubious given the explanation above), cumulating the impact of these scenarios is meaningless.
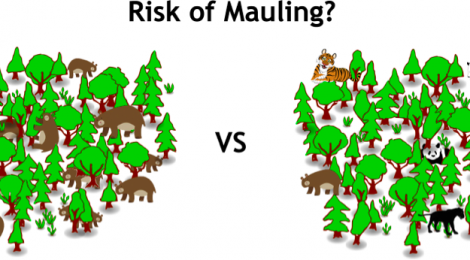
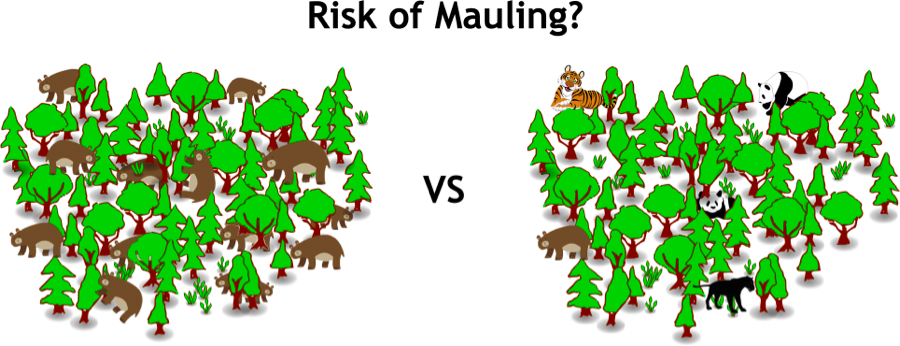
Allow me a predator-mauling-while-walking-in-the-woods analogy. Cumulating impact from individual scenarios for each peril is like attempting to measure my risk of getting mauled while walking through the woods, by cumulating my performance in one-on-one battles with the largest predator of each species present in the forest. The “riskiest” forests for mauling will clearly be those with greatest predator biodiversity (number of different species) rather than the much more meaningful density of mauling predators (of any species). The proper way to do this would clearly be to integrate my performance with predators of every size and species with the frequency of me bumping into such hungry predator while walking through a given forest (sum of performance weighted by frequency of occurrence). This is the crux of probabilistic risk assessment. This is understandably a difficult task to do for 616 forests exposed to numerous predators, let alone 616 cities. But complexity is no excuse for sloppy science.
The only justification that I could find in the Swiss-Re report for this scenario-based aggregated peril computation is:
“Urban residents who are threatened by multiple perils are more likely to be hit by a natural catastrophe in their lifetime than those confronted with only one peril.”
This is absolutely and utterly incorrect (Swiss-Re has many brilliant people who know better than this!). This is probability 101. It completely ignores the rate of occurrence of various perils. If a city is exposed to earthquakes (single peril) at a rate of severe event of 1 in a 100 years, its urban dwellers are still “more likely to be hit by a natural catastrophe in their lifetime” than those living in a city exposed to severe earthquakes and floods (multiple perils) occurring each at a rate of 1 in 500 year. Similarly, my risk of getting mauled has nothing to do with the number of species of mauling predators in my local forest, but rather with the absolute number of maulers (actually density and mauling rate would be better).
 A related issue is that population “affected” cannot easily be cumulated across scenarios. While the scenarios may be “a hurricane with winds substantially stronger than Sandy or a tsunami similar to the one triggered by the Tohoku earthquake in Japan,” it is clear that being “affected” by such a hurricane is quite different than “affected” from the Tohoku earthquake (comparing the death toll from these events in equally “developed” countries should be evidence enough here). Similarly, my experience with an angry bobcat along my forest journey would be different than stumbling into a bear. Not all mauling wounds are equal.
In addition, there is little discussion of the geographical unit which makes up the city, or why that is chosen as the appropriate unit for such study. Some on the list are multi-city conglomerates (e.g. Pearl River Delta). While there is a need to draw a boundary, it should be mentioned that this choice is a significant one. For instance, I’m sure that taken individually, the cities of Shenzhen, Guangzhou, Hong Kong, Donguan, Foshan and the others making up the “Pearl River Delta” would not be on the list. Note that the “city” of the Pearl River Delta covers 39,000 km2, while the entire island of Haiti (the country!) is only 27,000 km2.
In short, the Swiss-Re ranking has little meaning. That being said, the cities on the list are indeed exposed to significant hazards, and should be proactive about addressing them. And those cities not on the list should not feel too relieved, and maybe look more closely at what lurks in their forests.
———————————————
If you’re curious to read more of my qualms with the report. Here are some other, unorganized thoughts:
- Storms and storm surges are used as separate perils, but are clearly correlated hazard events (you can’t have a storm surge without a storm). Treating them individually leads to double counting. The logic of the report would justify treating earthquakes and liquefaction separately as well, but this would also lead to double counting.
- Volcanic risk is ignored (poor volcanoes). I understand Swiss-Re may not have a volcano model, but still this should at least be explained. History has many examples of cities buried by volcanoes (Pompeii and more recently Goma).
- Normalizing by city population would be informative. As a reader, I want to know my risk of mauling in a given forest, not the absolute number of mauling occurrences. There are more cases of violent crime in Los Angeles as there are in Burlingame, but that tells me little about anyone’s individual risk in these cities since they have vastly differing populations.
- There is no discussion of vulnerability, or the translation of hazard intensity to “affected people” other than a mention of “overlapping maps.” If the analysis actually comes down to “overlapping maps,” than it ignores all our achievements in reducing vulnerability (such as the successful implementation of high-performing seismic codes in Japan), or the increased risk to populations where such measures have not been taken. It’s not clear what they’re doing here though.
Many of the issues above cannot easily be addressed, nor do I expect them to be. But these limitations and assumptions should be discussed, because otherwise readers leave with a misguided sense of understanding. Disaster risk assessment is fundamentally about the treatment of uncertainty. Reports like this one provide a sense of authority and certainty, while there is tremendous uncertainty even in the best of models (which the report is a not!). We need to be more serious about communicating risk and uncertainty correctly and transparently.


 programme in this video produced by the IDRC's Pan-Asia Forum in 2009.")

 works to understand the relationship between research, policy and practice and promoting evidence-informed policy-making.")
