Critical techno-policy in Japan
When we use the word ‘critical’ in engineering we usually mean thresholds not theories. Neat boundaries rather than full-on discourse analysis. And I, for one, am all for these clear thresholds because they mean we can get on and DO stuff. This post is about one such line in the sand, now etched into 500km of Japan’s coastline. It’s a brief reflection on decision-making and tsunami risk from my experience with the EEFIT mission to Japan in June. The general questions it raises fall into what I want to call the ‘techno-political domain’. This is the term Austin Zeiderman uses when he talks about risk as ‘a technique for governing the future of cities and urban life‘ and it’s helpful here. I’ll start with the decision and its consequences and then work back through the evidence.
Decisions
Japan has three levels of government: national, prefectural and municipal. The national government made a decision that future protection from tsunamis along the coastal stretch hit by the 2011 event should be based on two levels of risk: Level 1 based on a 1 in 100 year event and Level 2 based on a 1 in 1000 year event. This doesn’t mean that a Level 1 tsunami will definitely, regularly or only happen once in a hundred years. It means that there is theoretically a 1% chance that a tsunami worse than Level 1 could happen in any given year. (Or a 0.1% chance for a tsunami worse than Level 2).
Consequences in Practice
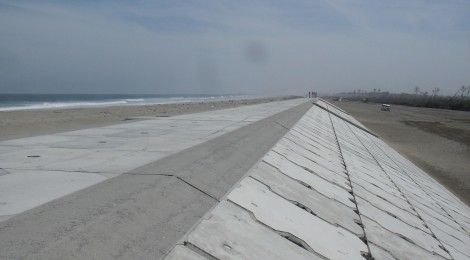
Once this threshold was set at a national level, the prefectural authorities modelled and mapped the zones that would be inundated by Level 1 and Level 2 tsunamis. Consultants were engaged to run numerical simulations based on a standardised tsunami model, sea walls were designed to resist a Level 1 event and any coastal strip between the height of the sea wall and the run-up (the line reached by the tsunami on land) of a Level 2 tsunami (less 2 metres) was demarcated as a zone where building would be prohibited. Responsibility for protecting different stretches of coast and nearby infrastructure was already clearly divided between a number of national ministries and the prefectures, so the (PHENOMENAL) clean-up operation and construction of sea defences began, while the municipal authorities were handed the risk map to use as the basis of their urban planning.
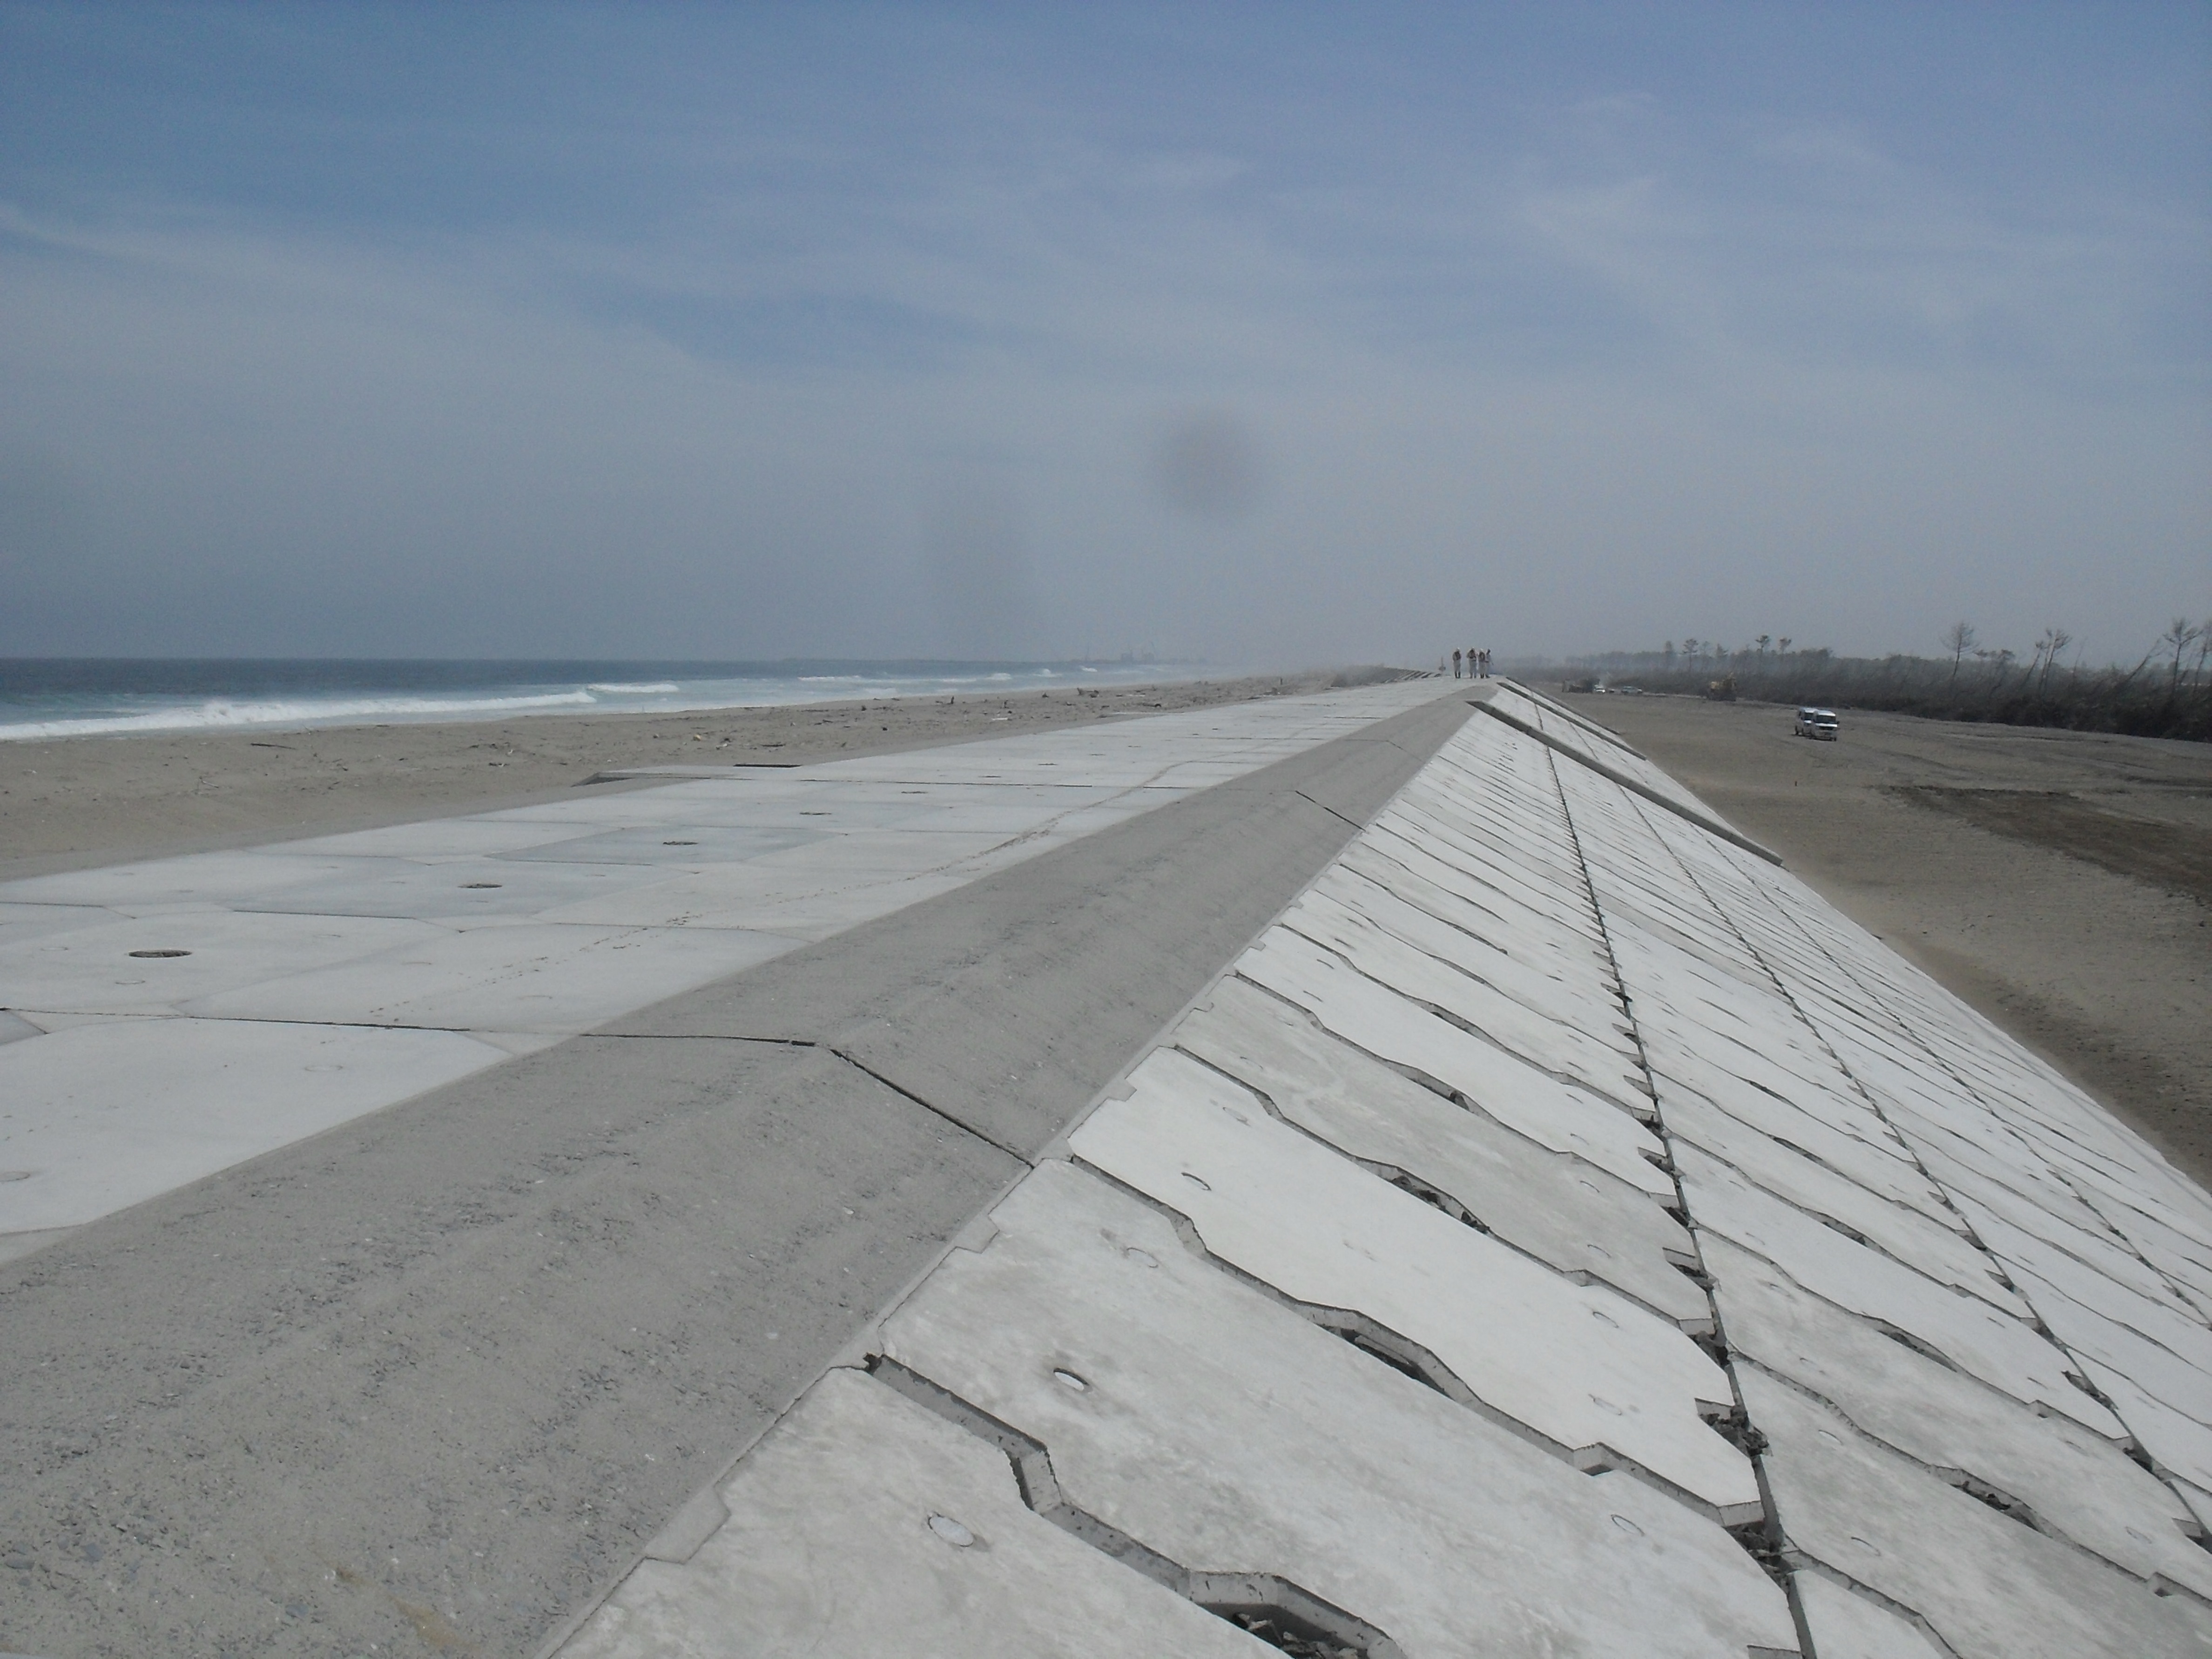
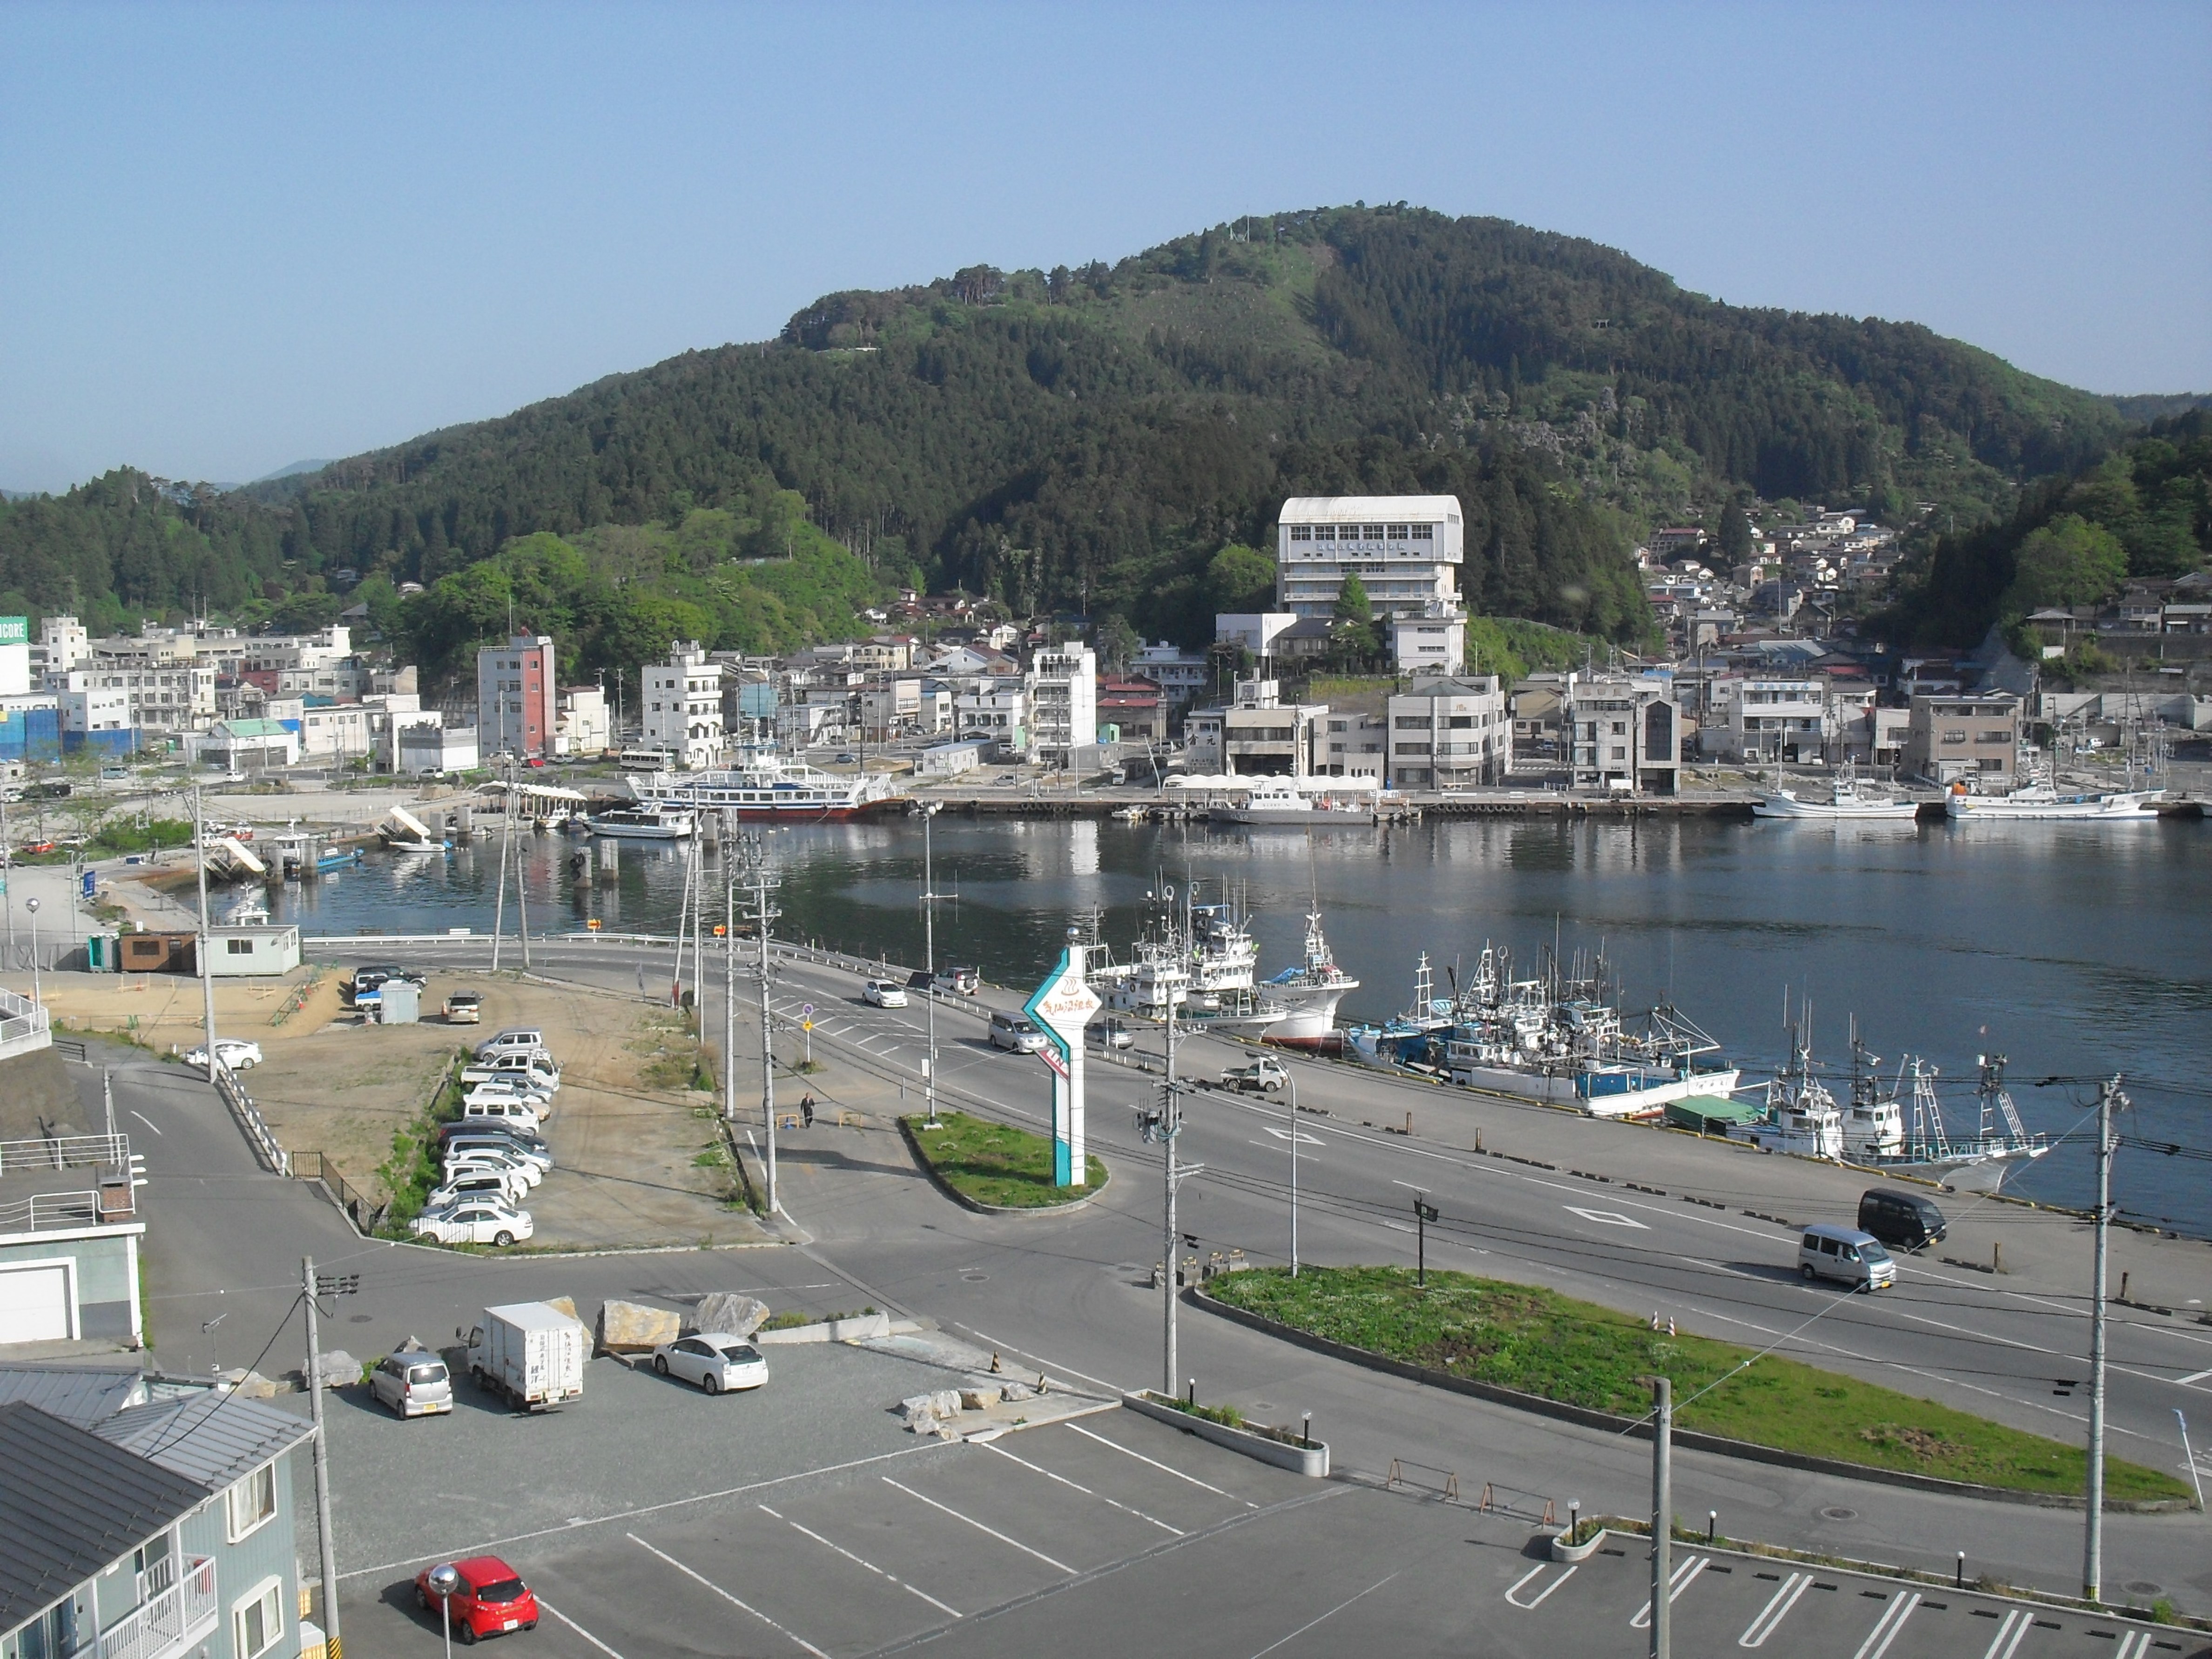
The only glitch seems to be that not everyone wanted massive sea walls: many of the coastal communities rely on fishing or tourism, both of which would be decimated by the new infrastructure. But if local people, backed or not by their municipalities, dug their heels in, the flow of national funds and the reconstruction would grind to a halt… One settlement did have some success calling on the prefecture to re-run the simulation without the protective wall but, if your town is the only section of the coast without a wall (which is what was seems to have been modelled), the tsunami is funnelled through a little gap and the simulated run-up is even worse! So, there was no opting out.
Evidence
But what was the evidence base for the decision on risk? There is archaeological and historical evidence about tsunami inundation; plenty of data on earthquakes and models explaining their mechanisms and potential for generating tsunamis in Japan and elsewhere; damage assessments from various geo-hazards in Japan; and detailed survey data mapping the sea floor and land heights. This all fed into the tsunami simulations – the technical bit of the ‘techno-political domain’.
From our brief, translated conversations with coastal dwellers, what seemed to be missing was any way of discussing at a local level:
- the uncertainties inherent in the models;
- the other risks faced by remote communities where people – including the ever increasing proportion of elderly residents – had ways of escaping tsunamis but not their dependence on an economy based on one or two capricious or precarious activities; and
- the fundamental reasons for drawing the lines based on convenient, but apparently arbitrary, round numbers like 100 and 1000… This is the political bit of the ‘techno-political domain’.
Building codes everywhere develop incrementally, as they are reviewed by officials, experts and interest groups with varying degrees of transparency and clarity. What is amazing is how many technical people seem to accept these numbers as sacrosanct once they are written: the history of the negotiations forgotten or unclear. Perhaps that’s for the best: maverick, free-style engineers throwing caution and thresholds to the wind might be a very bad thing. But what role should engineers play getting from risk information to risk-informed policy decisions? Would it help us to communicate evidence and listen to people – the householders who have to live with the risks – if we remembered that thresholds for acceptable risks are based on deliberation not calculation?
Why should we care? Because all around us, these thresholds of risk are being defined on our behalf, from public health to energy policy to mortgage lending. They shape where money goes. They affect the evolution of our cities and the way we live: our homes, our jobs, our families and our infrastructure. But it’s hard to know how these thresholds will affect us, where they’ve come from and how we can engage in changing them. And that’s in the countries where we live and vote…
Many thanks to our generous and insightful hosts for allowing us an incredible glimpse of Japan.


 programme in this video produced by the IDRC's Pan-Asia Forum in 2009.")

 works to understand the relationship between research, policy and practice and promoting evidence-informed policy-making.")
